Nubank US: Building a High-Yield Consumer Bank
An in-depth analysis of Nubank US as a standalone, regulated consumer finance institution built from first principles.
Executive Summary
This writeup evaluates Nubank US as a standalone, regulated consumer finance institution built from first principles. The model scales from individual customer economics to a full bank balance sheet, explicitly isolating unit economics, capital consumption, and valuation without relying on parent-company synergies.
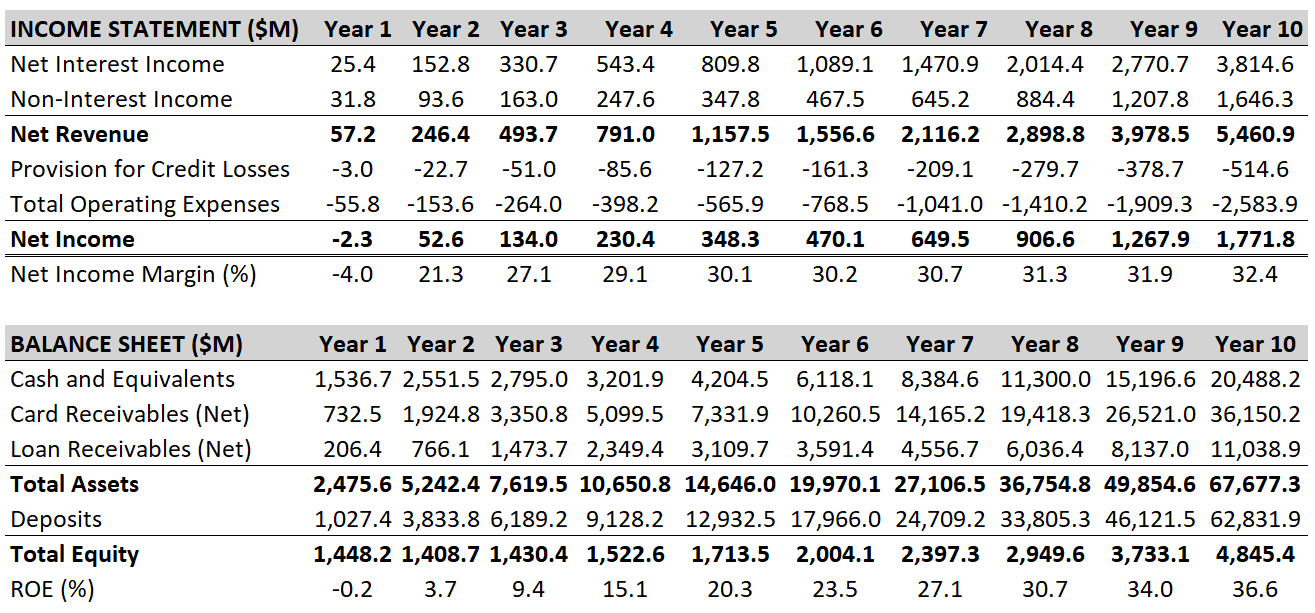
Under base-case assumptions, Nubank US scales to ~15 million active customers over ten years, generating $5.46 billion in net revenue and $1.77 billion in net income by Year 10. Profitability is achieved in Year 2, with ROA stabilizing in the 2.5%–3.0% range and ROE expanding to 36.6%, driven primarily by balance sheet leverage rather than margin expansion.
The operating model is credit-led and deposit-funded. Net interest income dominates revenue at scale, while deposits become the primary funding source, reducing reliance on wholesale funding and compressing cost of funds. As the portfolio matures, margins stabilize and operating leverage becomes the main driver of incremental profitability.
Capital emerges as the binding constraint rather than demand. Risk-weighted assets grow to $47.2 billion, compressing capital ratios toward regulatory thresholds and highlighting the capital intensity of sustained growth in US consumer finance.
Valuation outcomes vary widely across methodologies. A weighted average approach implies a central equity value of approximately $21.0 billion, equivalent to 3.8x Year 10 revenue and ~$1,400 per customer. Dispersion across outcomes reflects execution risk, capital constraints, and sensitivity to customer acquisition efficiency.
How This Writeup Is Structured
This analysis is built bottom-up, starting from the individual customer and scaling to a bank balance sheet.
The sections progress as follows:
A) Customer Cohorts
We begin by defining customer acquisition cohorts, activation rates, and behavioral assumptions. This establishes the base unit of the model: how many customers exist, how they behave over time, and how long they remain economically active.
B) Product Volumes
We translate customer cohorts into product usage. This includes deposit balances, transaction volumes, card usage, and credit penetration. Volumes are modeled per customer and then aggregated to the portfolio level.
C) Credit Risk
We layer in credit exposure, underwriting assumptions, loss rates, and seasoning effects. This section defines how much risk sits on the balance sheet and how it evolves as cohorts mature.
D) Revenue
We convert product volumes into revenue streams, including interchange, net interest income, and any ancillary income. Revenue is modeled gross and net of losses where relevant.
F) Funding Strategy
We then explain how the balance sheet is funded, including deposit composition, cost of funds, liquidity buffers, and any supplemental funding assumptions.
G) Financial Statements & Profitability Metrics
With revenues, costs, and funding in place, we construct the income statement, balance sheet, and cash flow statement to show how the business performs at scale.
H) Capital and Regulatory Ratios
We apply regulatory constraints, capital requirements, and leverage limits to assess whether the model is viable under US banking regulation.
I) Valuation
Finally, we translate the financial outputs into valuation, focusing on equity value, return on equity, and implied multiples for the Nubank US standalone entity.
A) Customer Cohorts
Customer acquisition is modeled as a marketing-driven funnel operating on monthly intervals. In Year 1, Nubank US generates 500,000 monthly leads, growing at 36% annually as brand awareness compounds. The conversion funnel applies sequentially: 25% of leads submit applications, 48% of applicants are approved, and 70% of approved customers activate their cards. This produces an 8.4% lead-to-activated-customer conversion rate, or approximately 42,000 new active customers per month in Year 1.
The activated customer is the core economic unit of the model. Customer acquisition cost is assumed to be $10 per activated customer, reflecting a digital-first strategy heavily reliant on organic referrals and low-cost distribution. This assumption is aggressive relative to incumbent issuers, which typically incur $150 to $250 per new account, and implicitly assumes Nubank can replicate its Brazilian acquisition dynamics in the US.
Retention is modeled via a 2.6% monthly churn rate, equivalent to roughly 27% annual attrition. This level is elevated relative to mature portfolios but consistent with early-stage consumer finance programs that include promotional cohorts and dormant accounts. The model does not explicitly separate voluntary churn from credit-driven attrition, though both are implicitly captured.
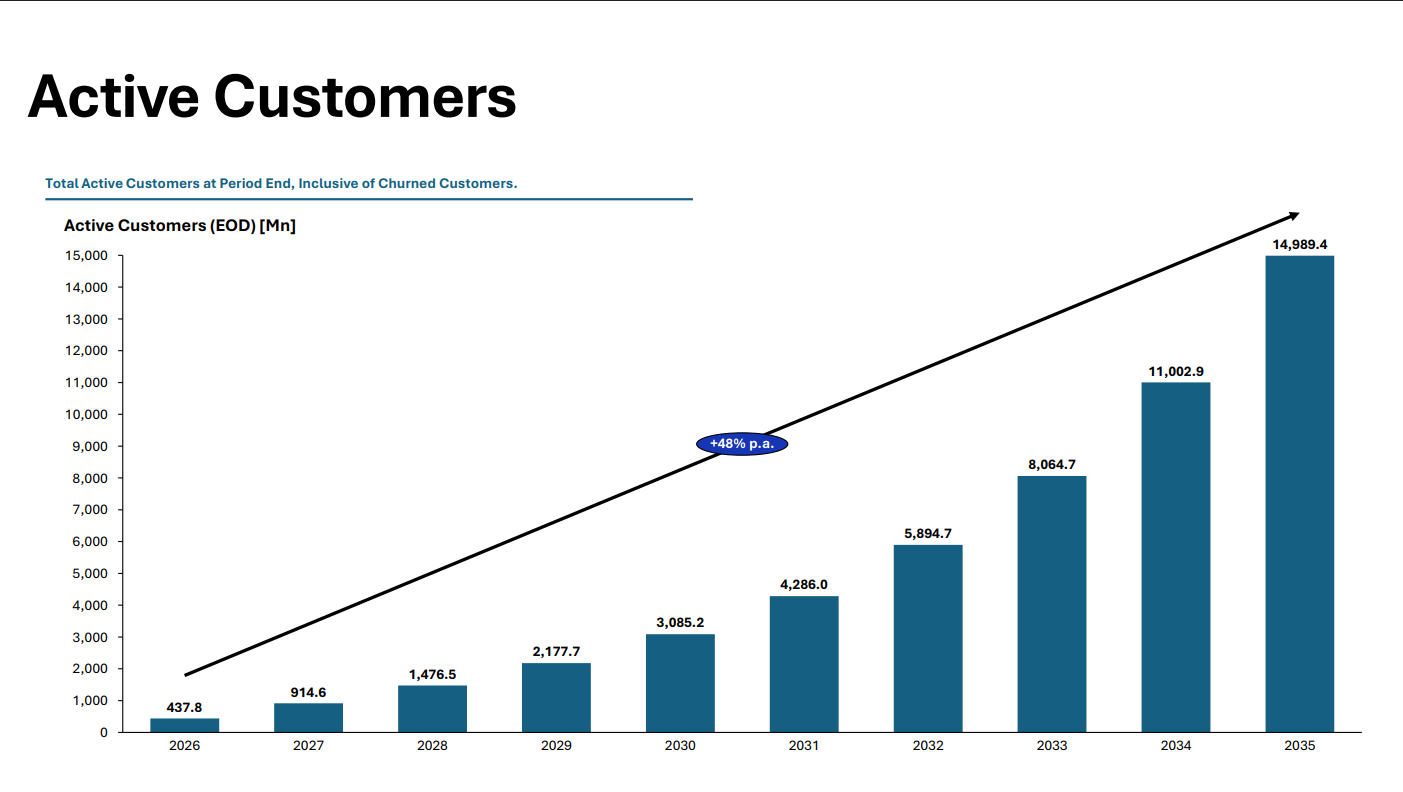
Active customers grow to approximately 438,000 by Year 1 end, 915,000 by Year 2, 2.2 million by Year 4, and 14.9 million by Year 10. Customer CAGR across the forecast period is 48.1%, decelerating as scale increases. Monthly active usage is assumed at 80% of the customer base, influencing transaction volume and interchange economics but not interest income.
B) Product Volumes
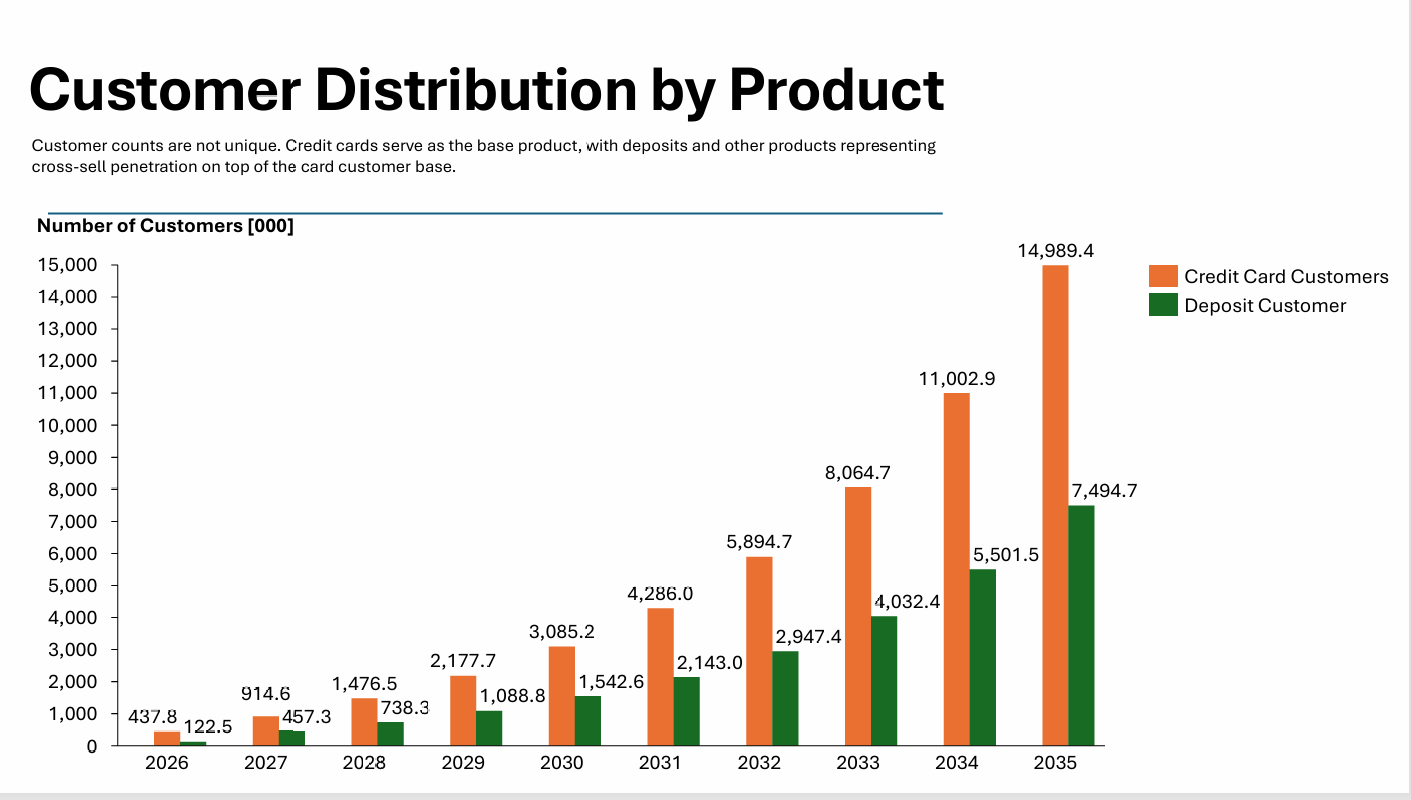
The product architecture is credit-card-led, with cross-sell into personal loans and deposits. Every active customer holds a credit card by definition. Personal loan penetration reaches 8% of the active base annually following a six-month seasoning period, resulting in 3.7 million loan customers by Year 10. Deposit penetration reaches 50% of card customers, reflecting the launch of a competitive high-yield savings product.
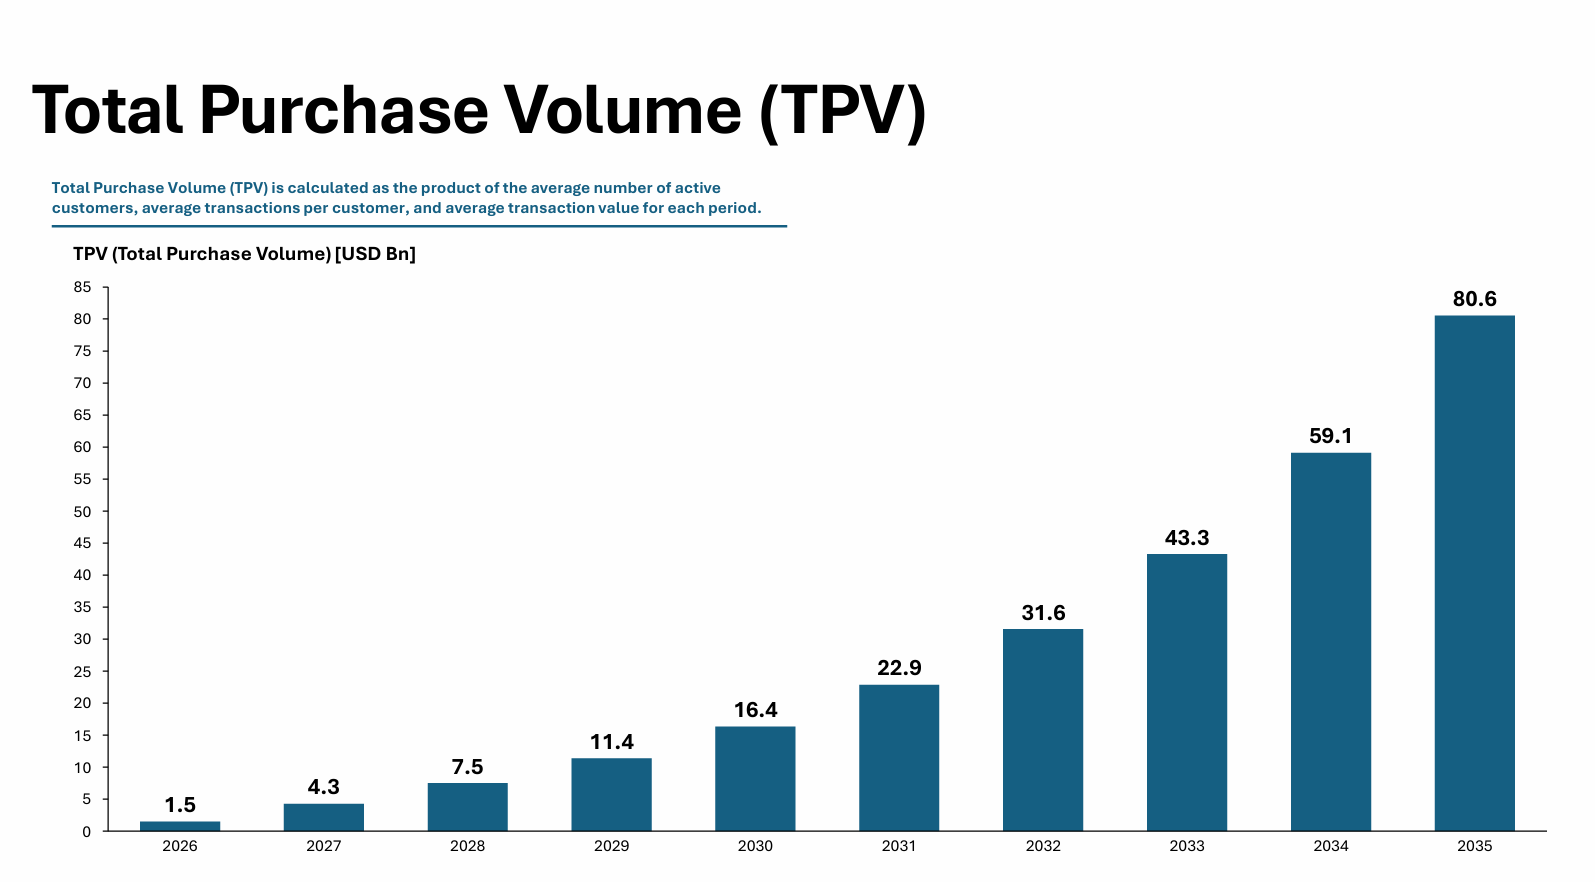
Card transaction volume is driven by monthly active users, transaction frequency, and average ticket size. The model assumes 22 transactions per active user per month at an average ticket of $23. Monthly total purchase volume scales from $21 million in January 2026 to $7.6 billion by December 2035. Annual TPV reaches $1.5 billion in Year 1 and $80 billion by Year 10.
Card receivables are a function of purchase volume, revolve behavior, and repayment dynamics. The revolve rate is assumed at 45%, with monthly principal repayments of 15% on revolving balances. Credit utilization stabilizes at 38% of available credit. Average credit lines are tiered by risk segment, producing a blended initial line of approximately $3,000 that expands over time.
Card receivables grow from $771 million at Year 1 end to $38 billion by Year 10. Loan receivables increase from $217 million to $11.6 billion. Total receivables reach $49.7 billion by the terminal year.

Deposit balances reflect a mix of primary and secondary banking relationships. Primary customers maintain average balances of $12,000, while non-primary customers average $2,000. With 49% of depositors classified as primary, blended balances range between $5,000 and $7,000. Deposits grow from $1.0 billion at Year 1 end to $61.6 billion by Year 10.

C) Credit Risk
The portfolio is segmented into 55% prime, 30% near-prime, and 15% subprime customers. This positions Nubank US between traditional prime issuers and subprime specialists. Annual default probabilities are set at 2.0%, 5.0%, and 10.0% respectively, producing a blended probability of default of approximately 4.1%.
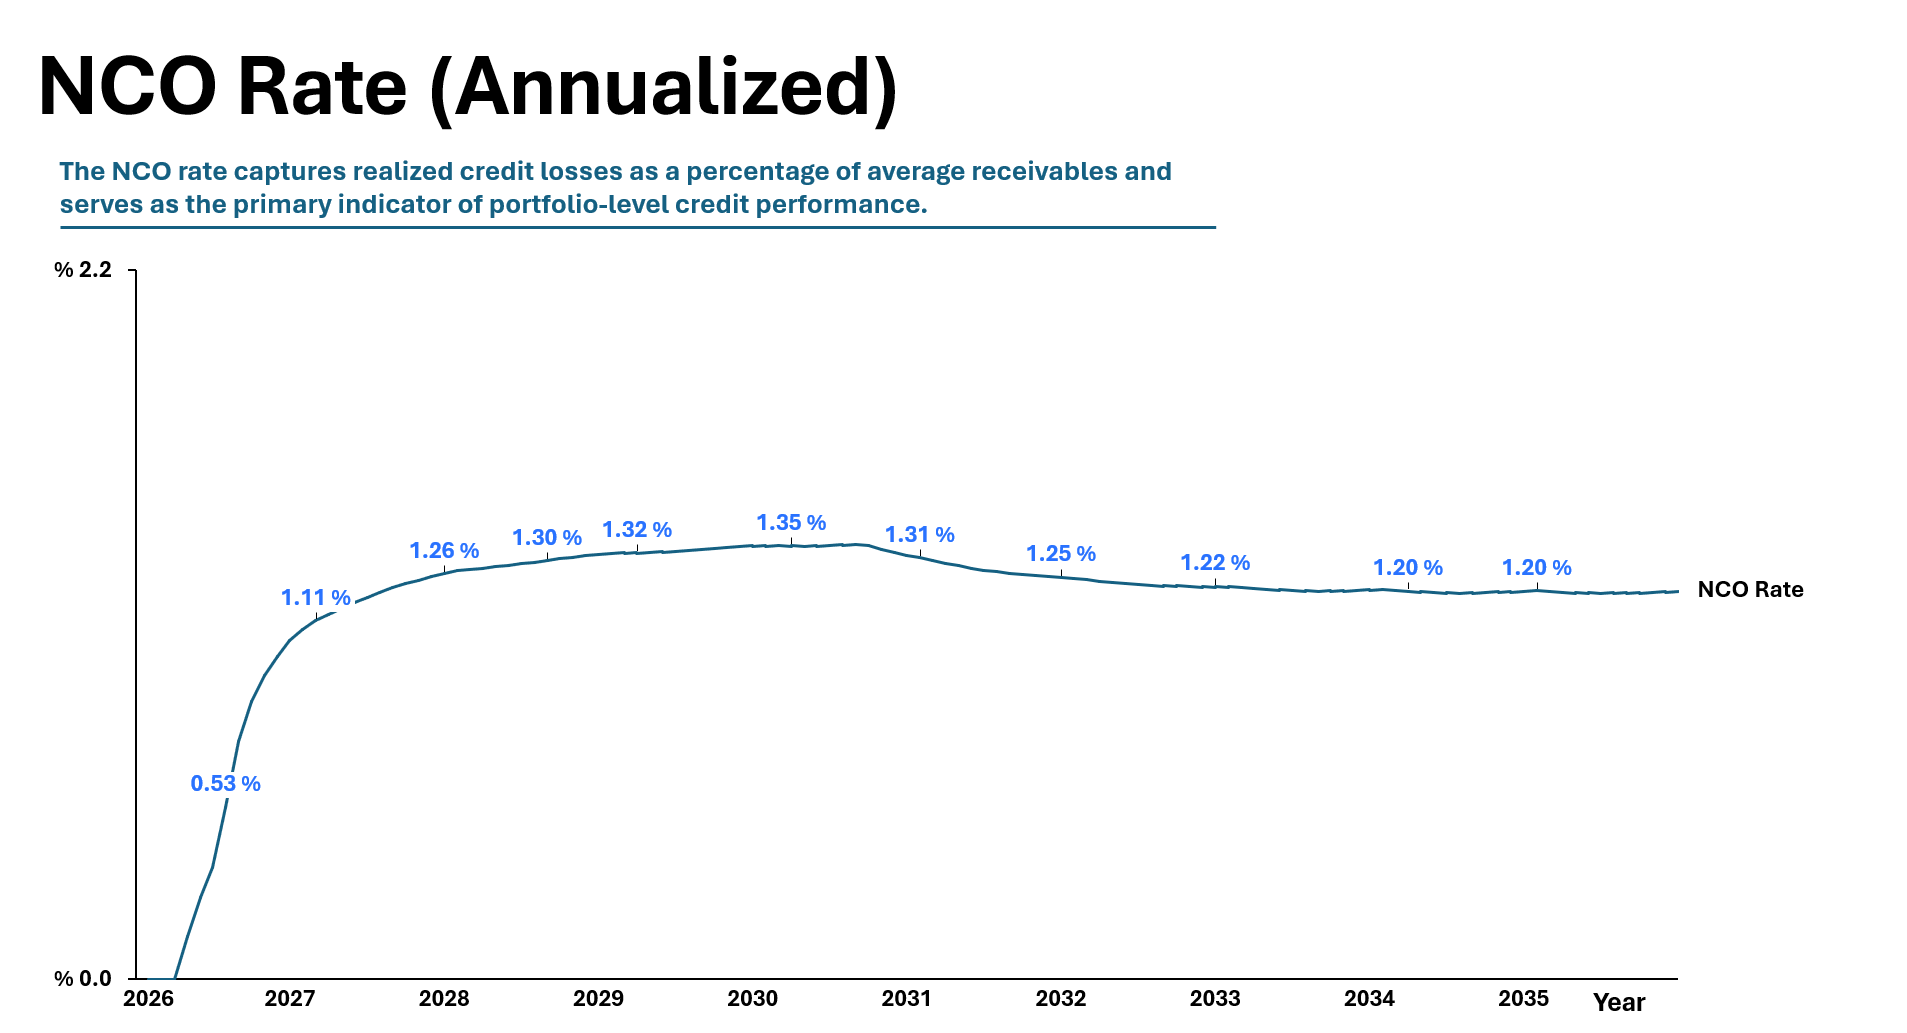
Loss given default is assumed at 75% for cards and 70% for loans. The resulting steady-state net charge-off rate is approximately 4.5%, elevated relative to prime portfolios but materially below subprime specialists.
Delinquency progression follows standard roll-rate assumptions, with charge-offs occurring at 180 days past due. Credit reserves follow CECL methodology, with Day 1 allowances set at 5% of receivables. By Year 10, reserves reach $1.9 billion for cards and $581 million for loans.
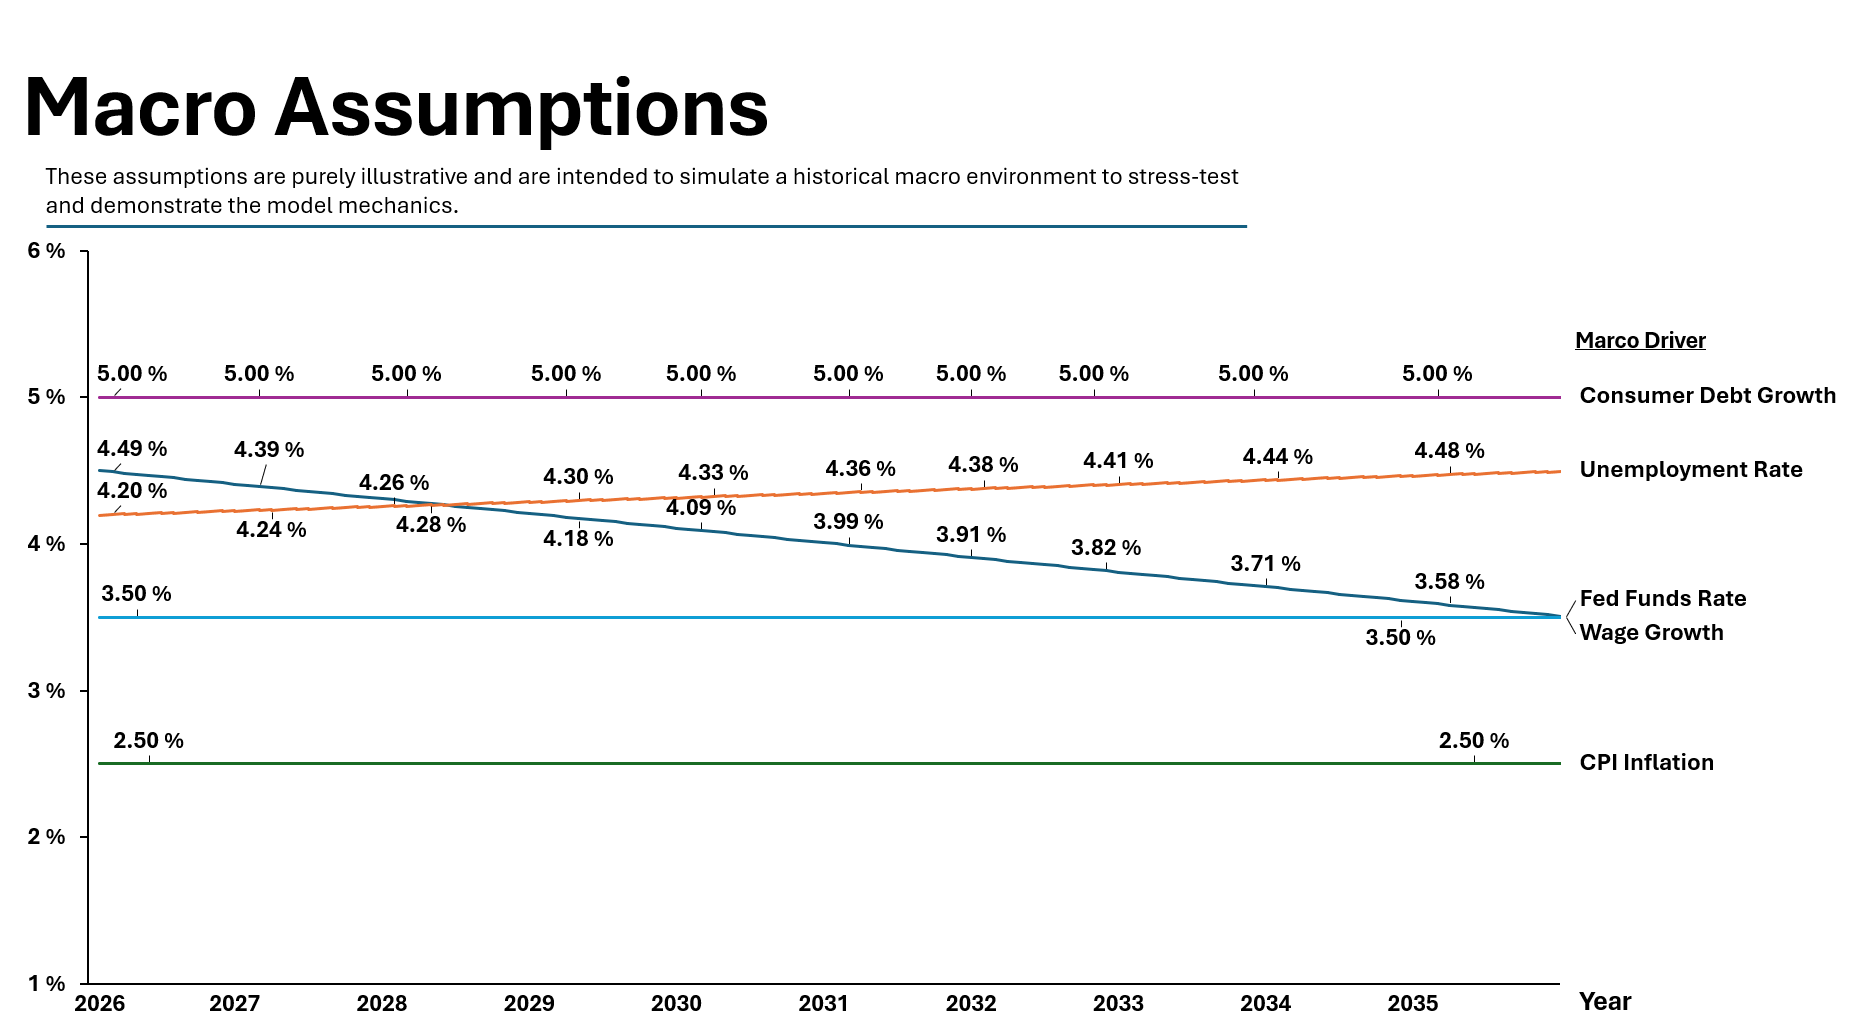
Macroeconomic sensitivity is introduced via a PD elasticity of 2.0x relative to unemployment changes. The base case assumes stable labor market conditions. Observed delinquency rates remain low throughout the forecast due to rapid portfolio growth, which dilutes delinquent balances and understates mature portfolio loss dynamics.
D) Revenue
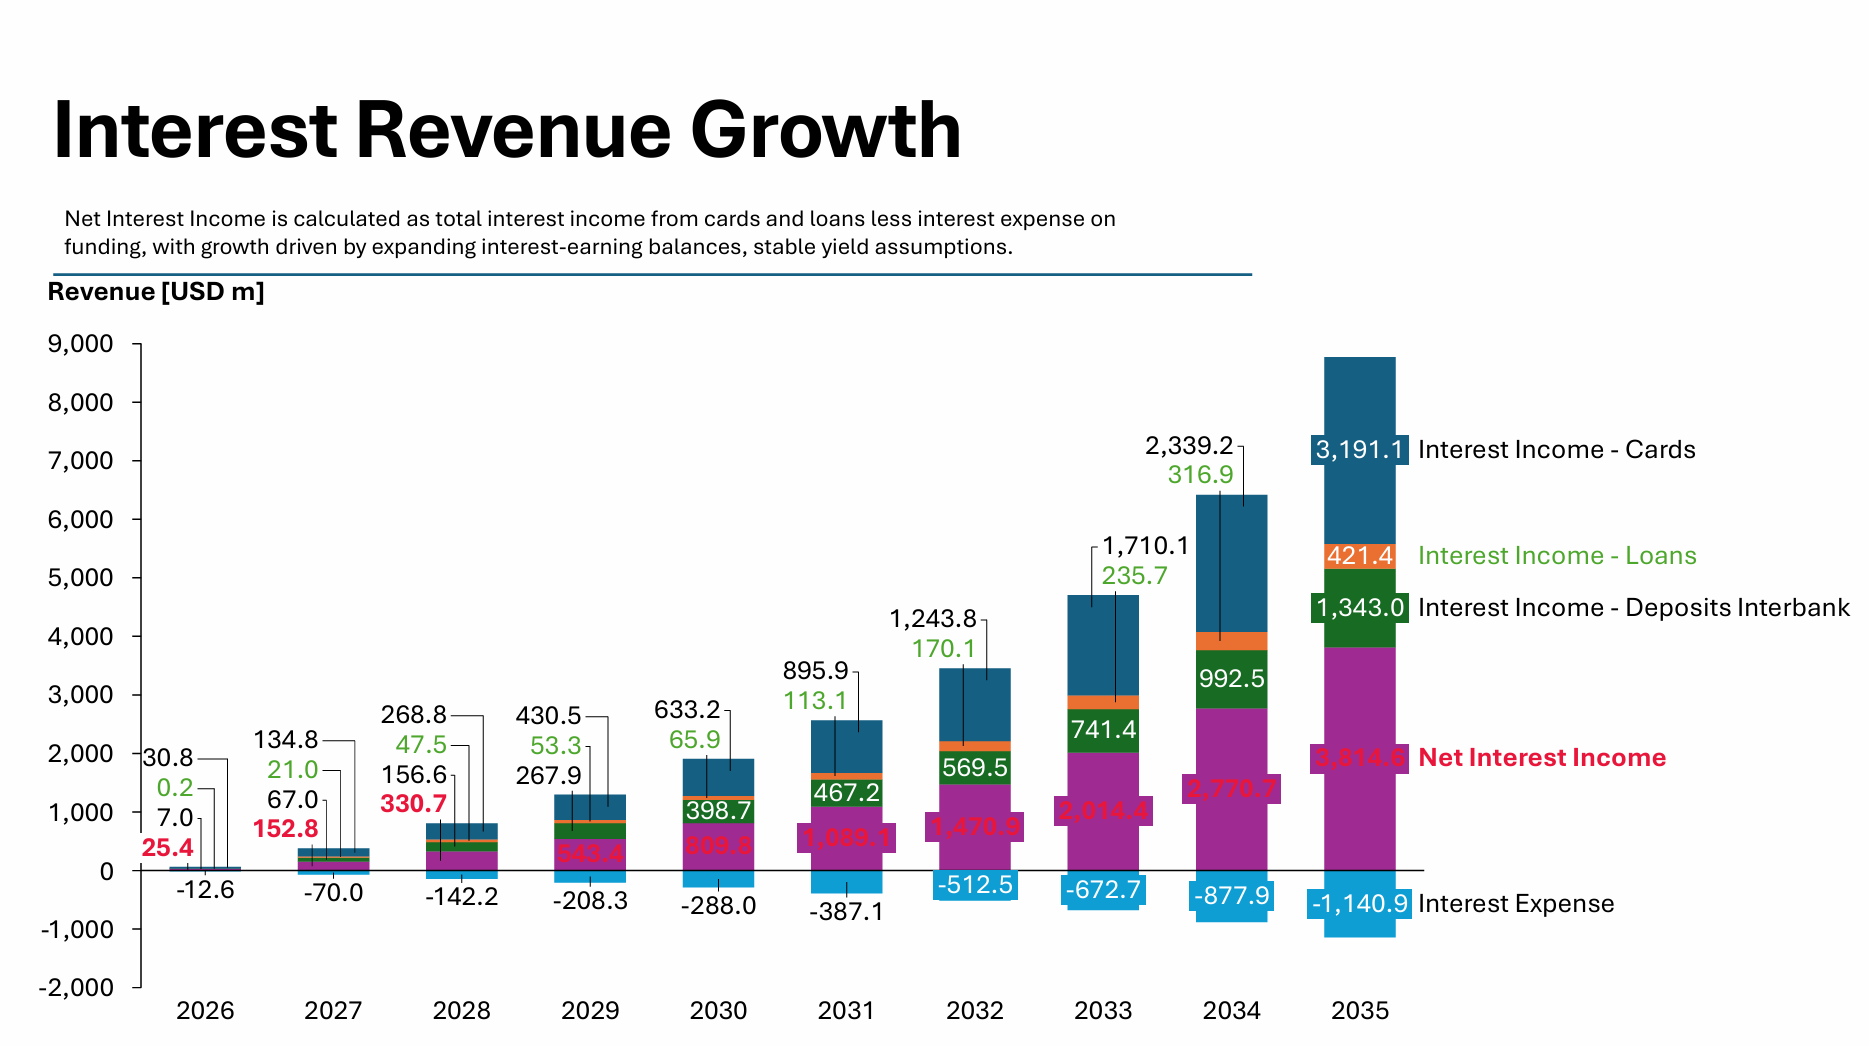
Revenue is generated from net interest income, interchange, and fees. Interest income is the dominant driver, generated through risk-based pricing on revolving balances. The blended card APR is 21.6%, while the blended loan APR is 13.4%. Monthly interest income scales to $305 million by December 2035.
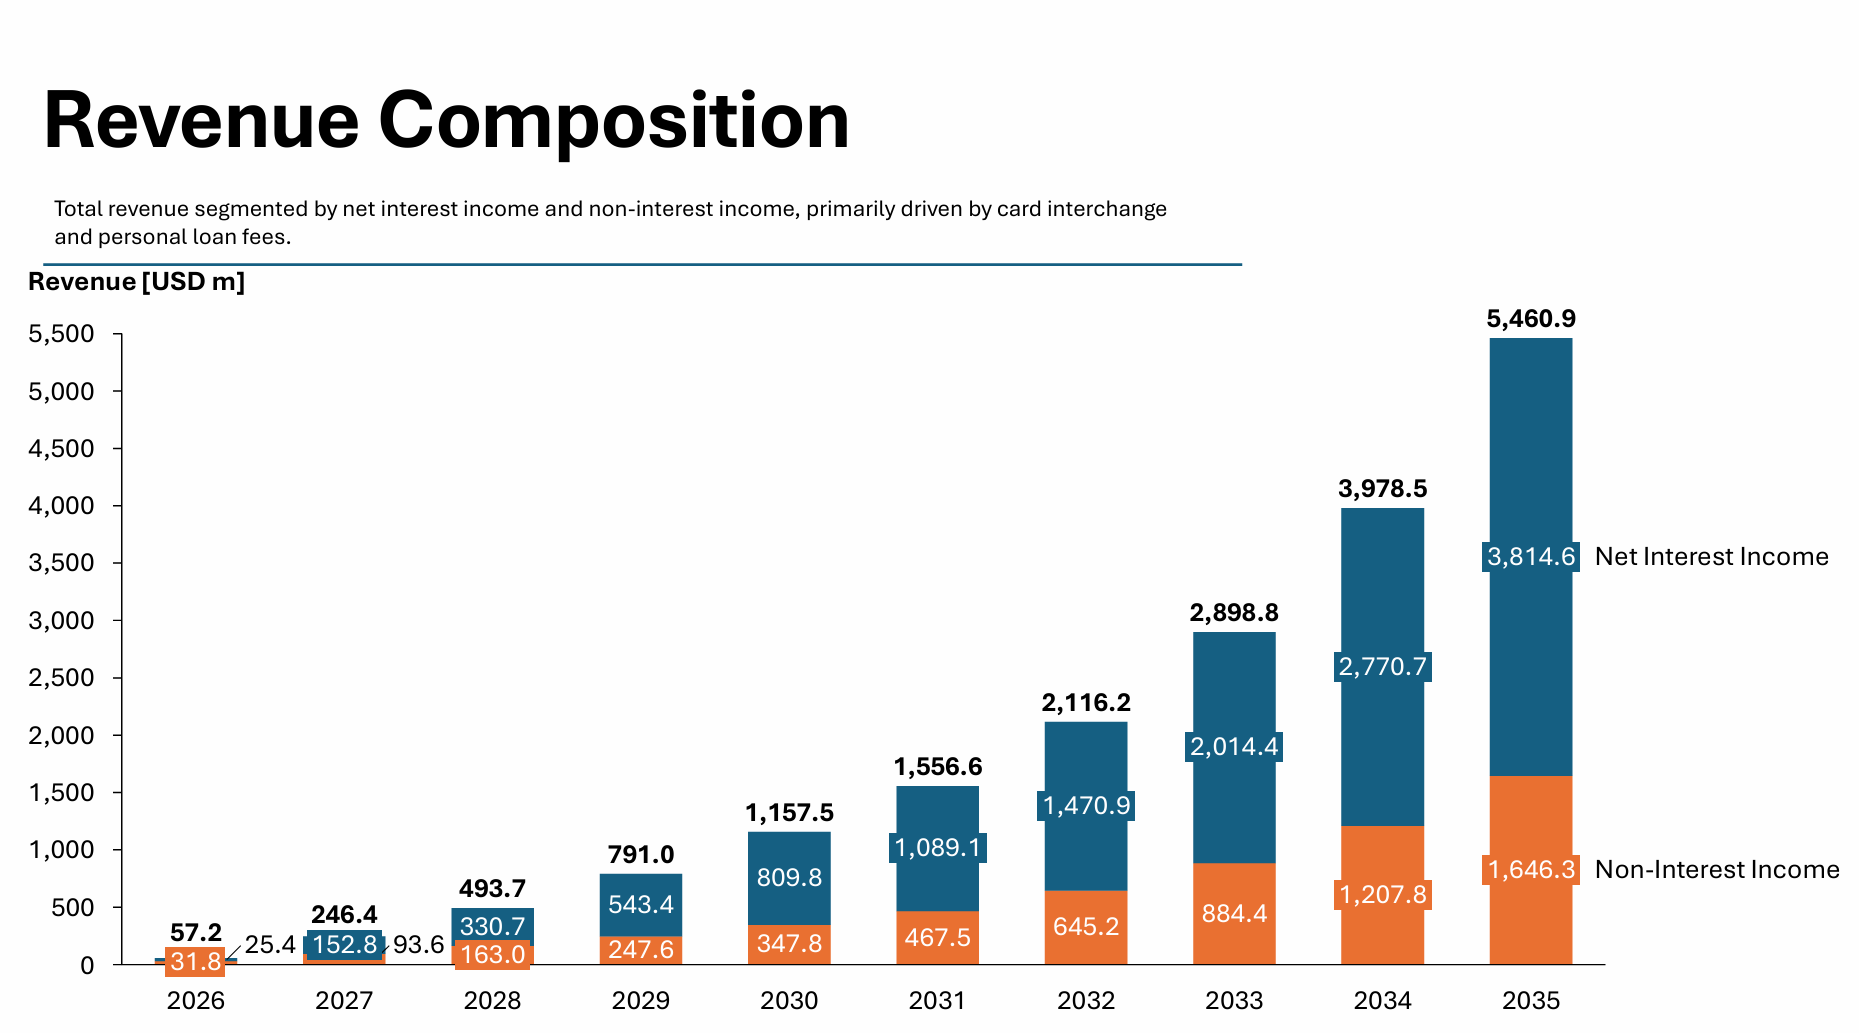
Net interchange is modeled at 0.8% of TPV after rewards and processing costs. Fee income includes late fees and loan origination fees, with no annual card fees assumed.
Total net revenue grows from $57 million in Year 1 to $5.46 billion by Year 10. Net interest income represents approximately 70% of revenue at scale. Revenue per active customer rises as cohorts mature, stabilizing between $290 and $365 annually in later years.
F) Funding Strategy
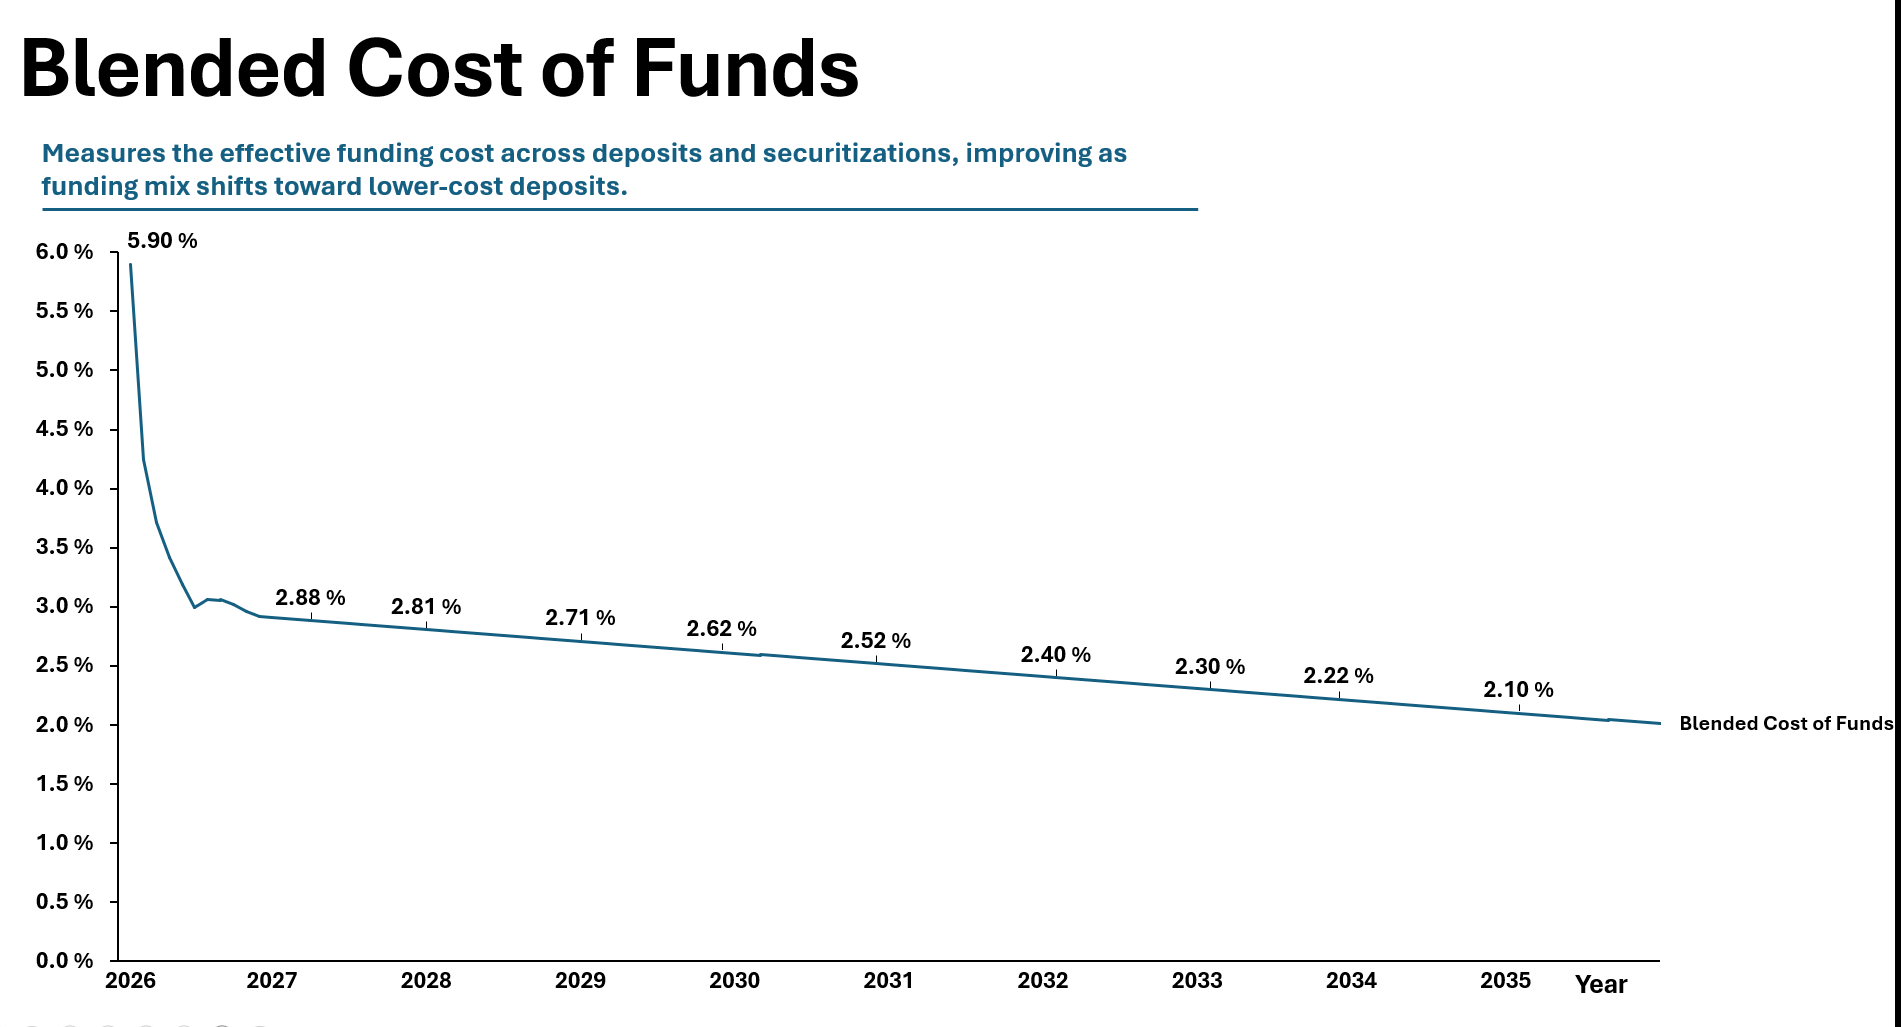
Initial operations are funded with $500 million of equity and limited asset-backed securitization. Over time, deposits become the dominant funding source. Deposit pricing begins at 3.0% APY with a 35% beta to Fed Funds. As rates decline, deposit costs fall toward 2.0%.
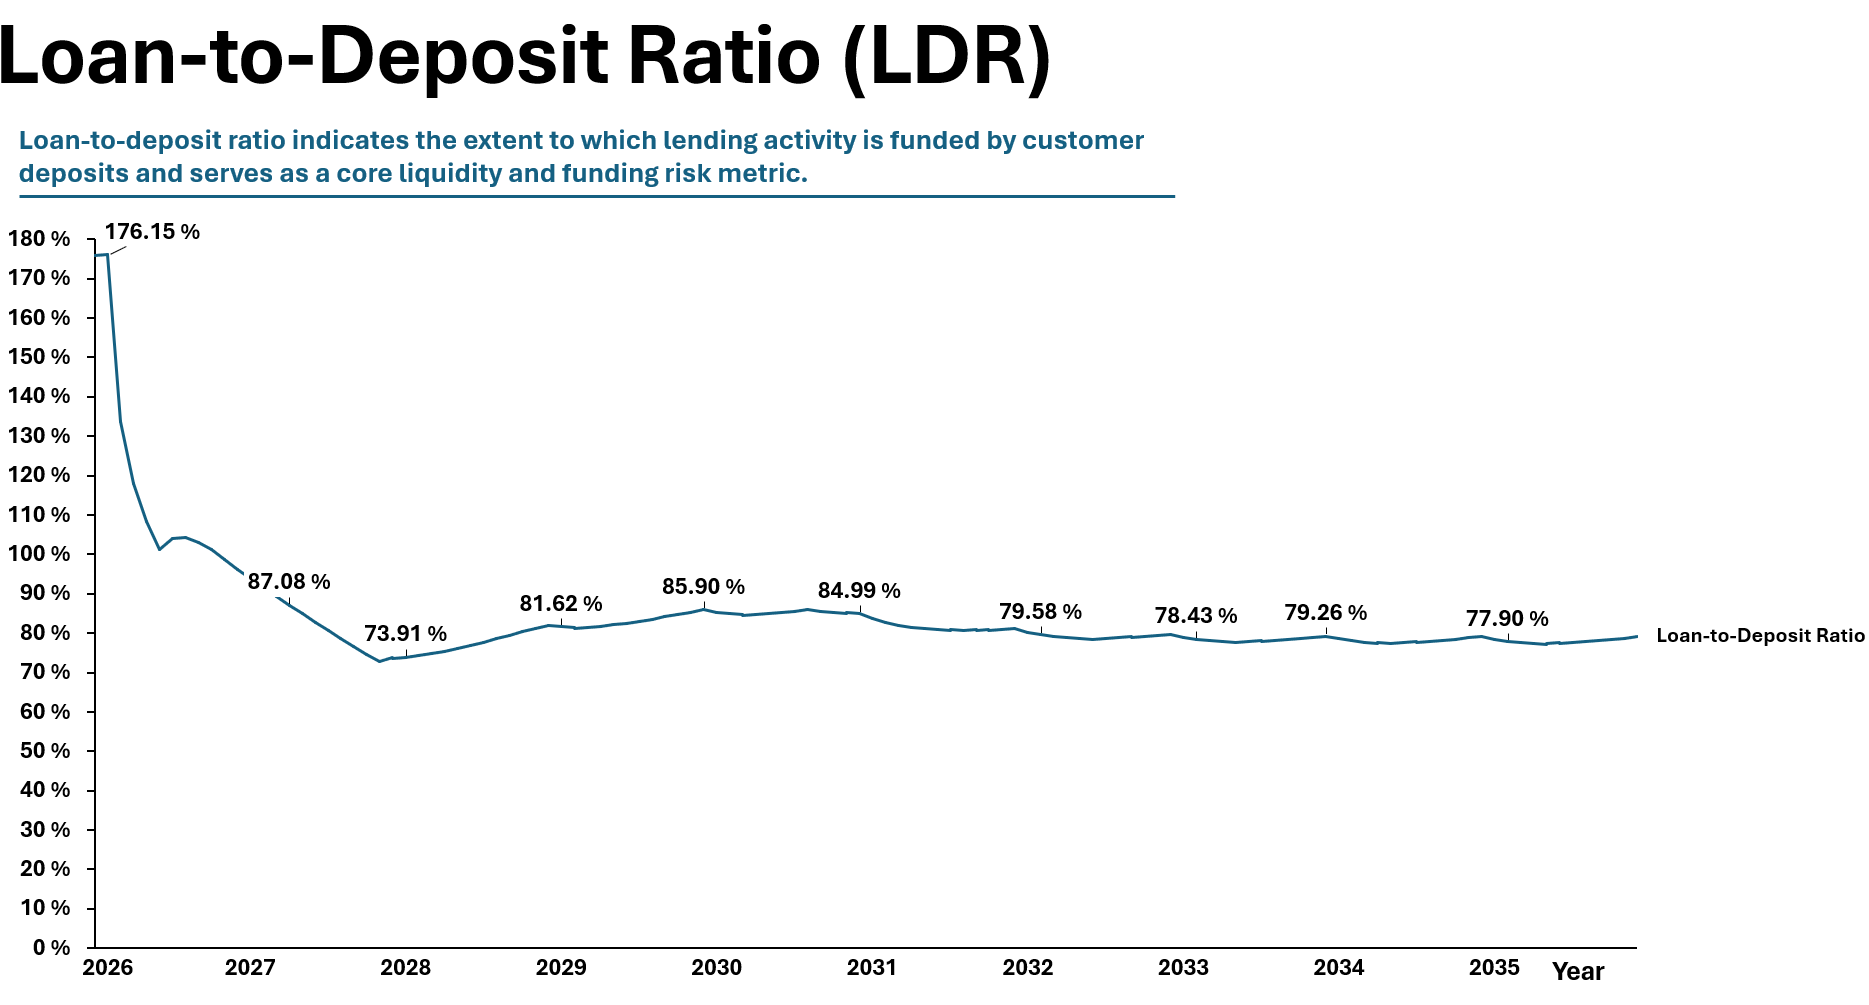
The loan-to-deposit ratio rises to over 75% by Year 10. ABS issuance is used sparingly when receivables temporarily outpace deposit growth. Liquidity buffers are maintained at a minimum of 8% of receivables. By Year 10, excess deposits result in cash balances exceeding $20 billion.
The blended cost of funds declines from 5.9% at launch to approximately 2.0% by Year 10. Net interest margin stabilizes between 7.5% and 7.9%, materially above traditional banks due to the high-yield credit card mix.
G) Financial Statements & Profitability Metrics
The profitability profile of the business follows the expected arc of a scaled consumer finance platform, with early losses driven by fixed operating costs and provisioning, followed by rapid operating leverage as the balance sheet matures and funding costs normalize. Net income turns positive in Year 2 and grows to $1.77 billion by Year 10, supported by sustained expansion in net interest income and disciplined cost control. The efficiency ratio improves materially, declining from 79% in the early years to 46% by Year 10 as revenue growth outpaces operating expense growth. Pre-provision net revenue exceeds 50% of net revenue by Year 5, indicating strong underlying operating profitability before credit costs.
Net interest margin expands sharply during the initial scaling phase as high-yield credit balances grow faster than funding costs and wholesale funding is progressively replaced by lower-cost customer deposits. NIM rises rapidly from sub-scale levels to approximately 8.8%–9.0% by the early 2030s, where it stabilizes. Beyond this point, margin expansion is limited, reflecting a mature funding mix and stable pricing assumptions rather than continued yield improvement. This stabilization underscores that long-term profitability is driven by balance sheet scale rather than incremental margin gains.
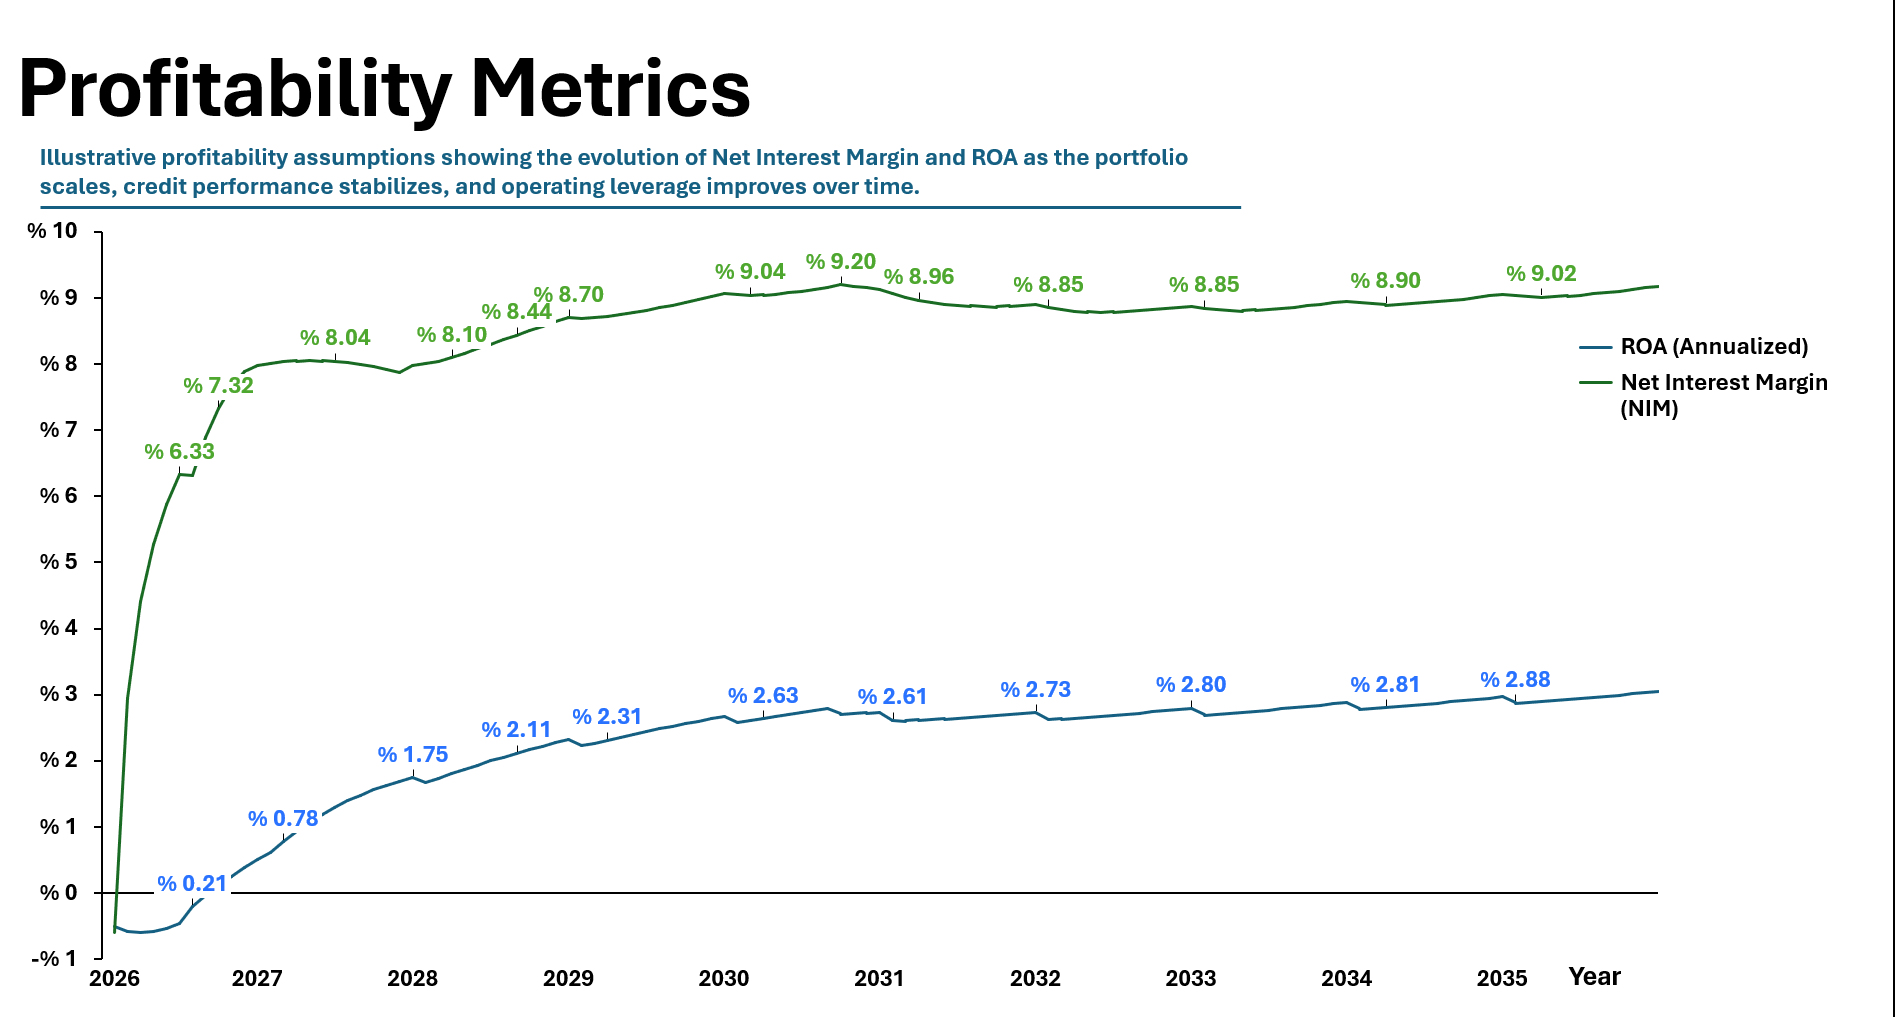
Return on assets improves in parallel with margin expansion and operating leverage. ROA increases from sub-1% levels at launch to a stable range of approximately 2.4%–3.0% as credit performance normalizes, cost efficiency improves, and the portfolio reaches steady-state maturity. ROA remains broadly stable thereafter, consistent with a mature consumer lending platform where asset-level economics are largely fixed once scale is achieved.
Return on equity follows a more pronounced trajectory, reflecting the compounding impact of leverage and retained earnings. ROE accelerates from low-single-digit levels in the early years to over 20% by Year 4, exceeds 30% by the early 2030s, and reaches approximately 36%–40% by Year 10. Unlike ROA and NIM, which stabilize relatively early, ROE continues to expand as the balance sheet grows faster than equity, driven by deposit-funded leverage rather than improvements in asset yield.
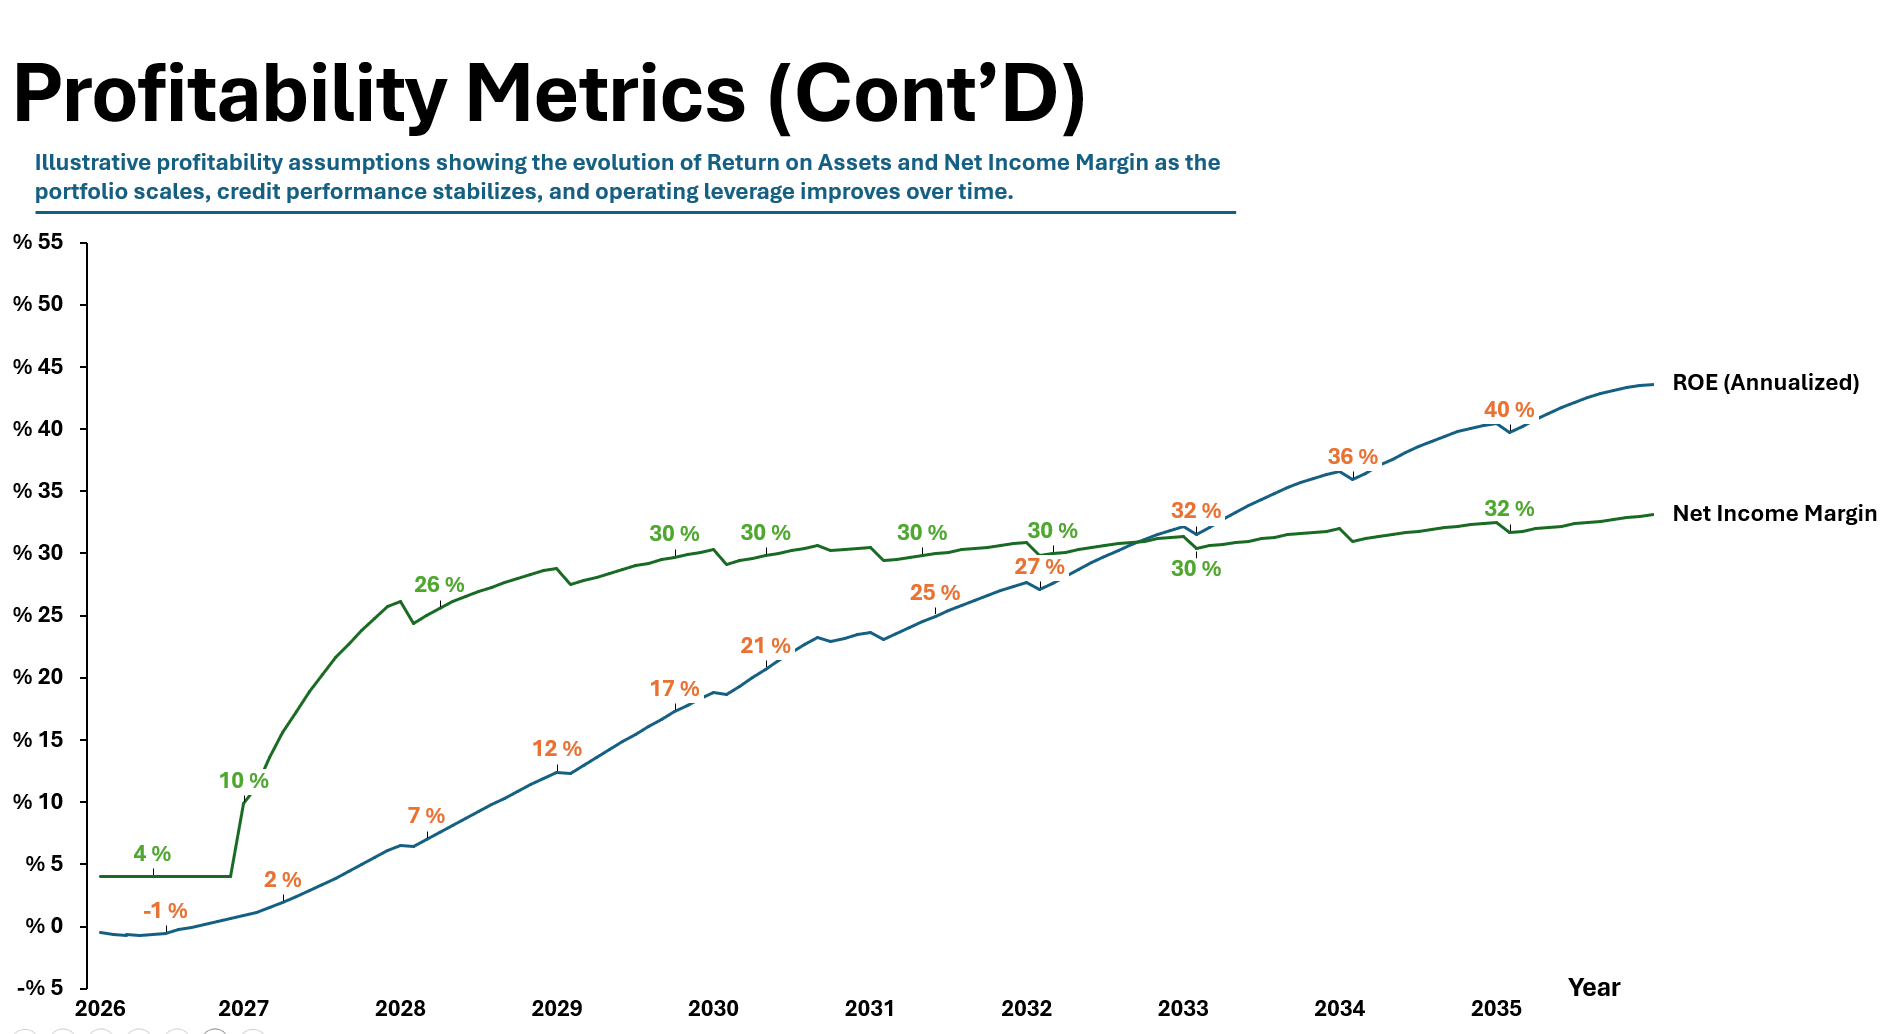
By Year 10, total assets reach $67.7 billion, funded predominantly by customer deposits, which form the core liability as wholesale funding becomes marginal. Retained earnings grow common equity to $5.8 billion, with no dividends distributed throughout the forecast period. The widening gap between asset growth and equity accumulation explains the continued expansion in ROE despite stable operating margins.
The divergence between operating profitability and equity returns highlights a central structural feature of the model. While net interest margin and ROA stabilize once the platform matures, equity returns continue to scale until capital becomes the binding constraint. At steady state, further ROE expansion would depend less on operating performance and more on capital management, balance sheet optimization, or external equity actions, rather than improvements in core lending economics.
H) Capital and Regulatory Ratios
Risk-weighted assets grow to $47.2 billion by Year 10. The CET1 ratio compresses from an initially overcapitalized position to 10.3% by Year 10, below a 12% management buffer but above regulatory minimums. The leverage ratio remains above 5%.

I) Valuation
The valuation is grounded in the company’s projected financial profile, which shows a rapid transition from early losses to scale-driven profitability. Net revenue grows to $5.46bn by Year 10, with net income reaching $1.77bn and net income margins expanding to 32%. Total assets scale to $67.7bn, funded predominantly by deposits ($62.8bn), while retained earnings grow equity to $4.85bn. ROE expands to 36.6% by Year 10, driven primarily by balance sheet leverage, with ROA stabilizing in the 2.5–3.0% range.
Against this financial base, multiple valuation methodologies are applied. A DCF implies equity values between $4.2bn and $8.8bn, reflecting conservative terminal assumptions. Revenue multiples, applied to Year 10 net revenue, imply a wider range of $16.4bn to $43.7bn, consistent with high-growth, deposit-funded consumer finance platforms. Customer-based valuation yields $6.0bn to $18.0bn, while trading comparables suggest $8.2bn to $17.5bn, with M&A precedents implying higher outcomes given strategic value and balance sheet optionality.
A weighted average across methodologies produces a central valuation estimate of $21.0bn, implying 3.8x Year 10 revenue and approximately $1,402 per customer. The implied LTV/CAC of 38.9x is driven by strong unit economics and a $10 CAC assumption, and remains highly sensitive to customer acquisition cost inflation rather than margin compression or credit deterioration.

Conclusion
Nubank US is not demand-constrained. It is capital-constrained.
The model shows that a credit-led, deposit-funded platform can reach profitability quickly and generate strong equity returns in the US. However, once scale is achieved, ROA and NIM stabilize and incremental value creation comes almost entirely from balance sheet leverage enabled by deposits.
At steady state, upside is driven by capital efficiency, funding mix, and regulatory optimization rather than improvements in product economics. The key risks are CAC inflation, credit normalization in a stressed macro, regulatory execution, and competitive pressure from lower-cost incumbents.
Ultimately, Nubank US is a test of whether a digitally native underwriting and distribution engine can compound equity value within one of the most capital-intensive banking markets in the world.
Footnotes
- This article is intentionally technical. It took over 50 hours to build because simplifying a business like this without doing the work leads to the wrong conclusions. Consumer finance is a balance sheet problem, not a branding story. The only way to understand it is to model it end to end, from customer behavior to capital constraints.
- The model is not tied to a calendar year. All assumptions should be read from the point of launch, whether that happens in 2026 or later.
- I write pieces like this because they force me to understand complex systems properly, then break them down into something coherent. I would not be where I am today without constantly pushing myself to learn deeper and think more structurally.
- You can access the full model and the charts used in this article from here. I shared the full build and assumptions openly. If you ever want to build a bank, feel free to use it. Just do not forget to let me invest :).